R Art: first attempt at a project scale production
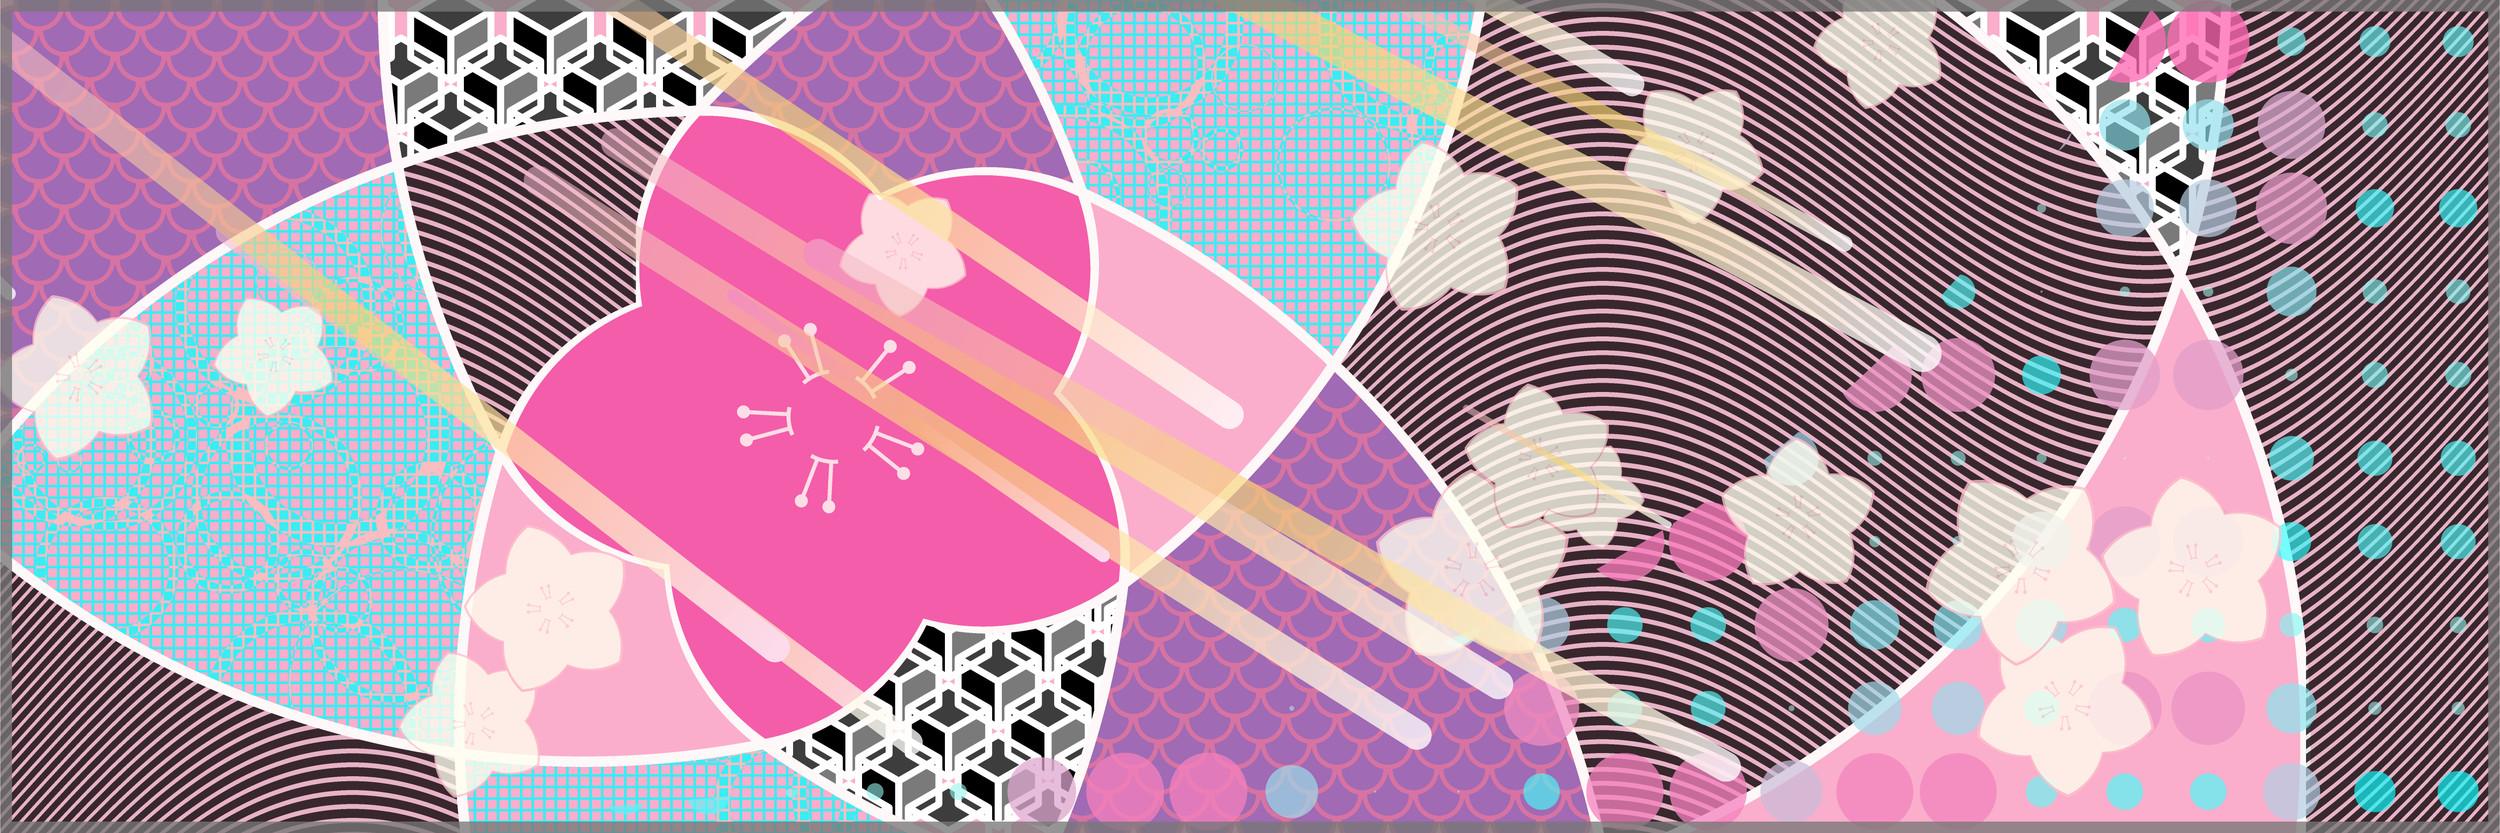
This is the highest effort image I’ve created to date. It’s designed to be printed on 36”x12” paper at 300dpi for a total of 3.9M coordinates. In total it takes around 1.5 hours to render the 8 layers on my machine, for a processing rate of about 60k points per second. In terms of backend accomplishment I feel pretty satisfied. (Composition documentation below)
I like the way this looks. Especially once printed, it feels powerful to have created. But a question sits uneasily in my stomach: Is what I made ‘art’. The healthiest answer is probably — who cares since I liked making it?
In my mind, what makes this project interesting is the method. Each line, arc, etc., is coded from absolute scratch. But nothing about this product requires it to have been done in this manner. A skilled graphic designer could have built almost all elements of this in Adobe Illustrator in a matter of hours and slapped it on a Cherry Blossom Festival marketing flyer. The value of this system is its ability to procedurally generate images — and this project isn’t the best application of that. In coming weeks I’ll be exploring what is.
Each layer consists of a dataframe of 3,888,000 rows and 3 columns (x,y,paint). X values range 1:10,800, Y from 1:3,600, and paint from -1:2. All surfaces are defined mathematically:
Cherry blossoms are shaped using regular pentagons and circles with radii equal to the pentagon side length. Upon placing a circle on each pentagon vertex, taking the coordinates where 3 circles meet forms a flower form.
Contrail extensions to cherry blossoms are described by mathematically calculating the location and derivative of the curves of petal outlines at their tip, choosing a point a constant distance along the vector orthogonal to this curve, and drawing a semicircle with this point as the origin
Upon drawing contrail extensions, a series of convex shapes emerge, which we can use our masking function to pull and fill with other textures.
Several elements are merely results of experimentation with over lapping circles and lines, some made opaque and others not
The current backend setup only allows for one ‘paint’ value for each x/y coordinate in each layer (no r/g/b coloring) so to achieve different color spectrums we introduce different layers (new 10800x3600 plots)
There’s two functions used here that I want to explore more of:
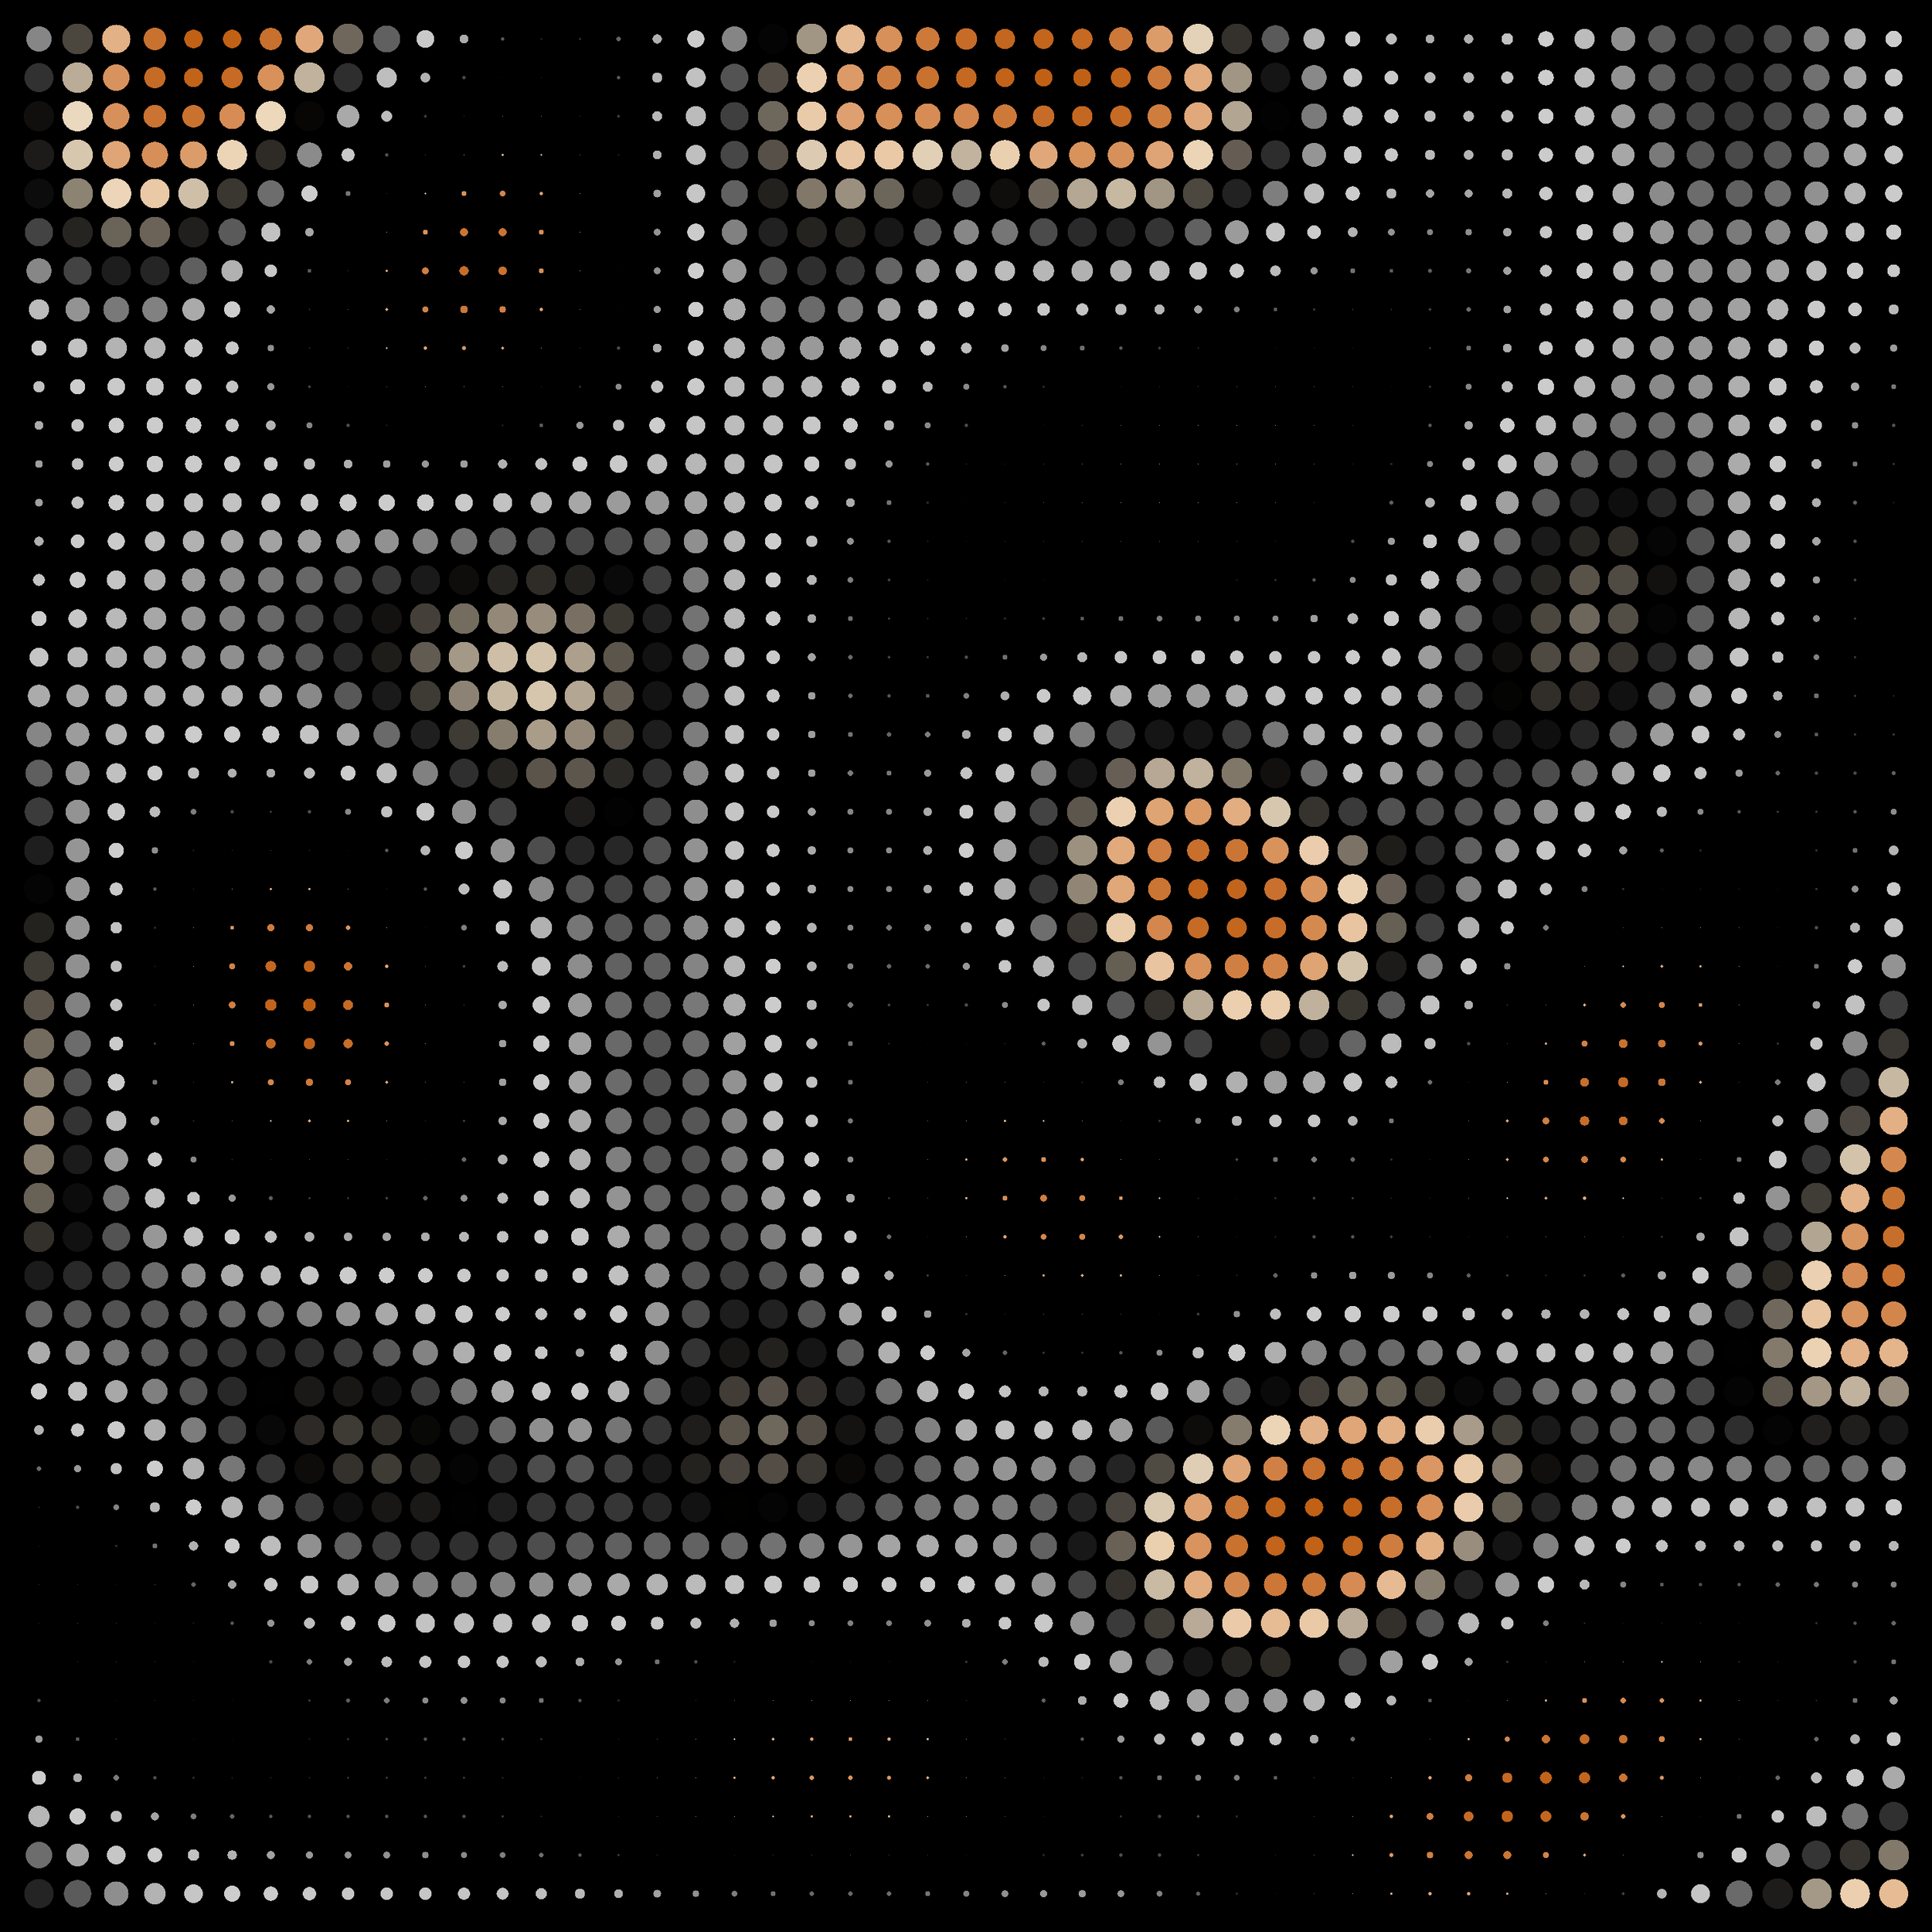
Coordinate dots: takes a function f:(x,y)→(z1,z2) and uses the two z values to determine color and size of dots to be drawn at each x/y coordinate. In this case f is a batched random function (some coordinates behave similar to other near ones). Other versions of f can yield neat results:
Repeated parametric functions: in the background of this project is a layer consisting of repeated sinusoidal functions. This is built with each line being its own parametric curve; I found repeating with different starting coordinates can yield texture

These last two functions will form the basis for future exploration. Adobe Illustrator is a system where a human uses a computer to draw. This system allows us to hand over control to the computer to make specific decisions and merely present it with guidelines.